I hesitate to post this because I don't want you to miss the previous post about forks.
Be sure to read that and the market recap from Friday.
I'm constantly trying to invent new studies. Here's something I accidentally discovered.
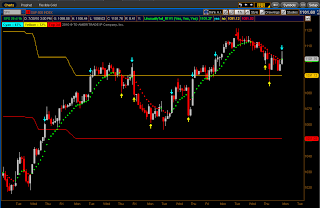
The above charts are of a study I'm working on.
Part of the study involves determining where Price is in relationship to the yearly high and low.
These charts show the market divided into thirds.
I planed to use this study on a daily chart, so because there are about 255 trading days in a year I designated that the data go back 255 bars.
What I find fascinating is that these levels appear to be significant, especially in the lower time frames of Hourly and Minute.
Not an earth shattering discovery but I felt it worth noting as it does not rely directly on Fibonacci relationship to peaks and valleys. Of course 0.382 and 0.618 may be the reason this appears significant.
Analysis presented on this Blog has only informational, and educational purpose, and does not represent a proposal for buying or selling contracts, equities or currency.


No comments:
Post a Comment